How to Choose a Waste Water Treatment System?

Time:2026-10-28 Author:Oliver
0%

Choosing a waste water treatment system is not a simple equipment decision. It is a practical engineering judgment shaped by flow, contaminants, space, budget, and future demand. A small food factory may discharge greasy water, while a hotel may release wastewater unevenly throughout the day. These differences matter.

A reliable selection begins with measured information. Record daily flow, peak discharge, pH, suspended solids, oils, nutrients, and temperature. Laboratory testing is more dependable than visual inspection. A clear tank does not always contain safe water. I have seen projects underestimate weekend surges and overload systems that looked sufficient on paper. That mistake can increase maintenance costs and reduce treatment performance.

The site itself deserves close attention. Check available land, drainage levels, power supply, access for sludge removal, and the operator’s practical skills. Biological systems can perform well, but they require stable operation and regular monitoring. Membrane systems may produce high-quality water, yet they often need careful cleaning and skilled maintenance. Chemical treatment can be effective, although chemical storage and dosing must be managed responsibly.

Performance targets should match the intended discharge or reuse application. Confirm local requirements with qualified professionals and relevant authorities. Manufacturer claims should be compared with independent test data, service records, and lifecycle costs. The cheapest quotation may not be the least expensive choice. It may hide energy use, replacement parts, or difficult servicing.

A sensible decision leaves room for uncertainty. Waste Water characteristics can change with production, seasons, and cleaning practices. Choose a system that can adapt, not merely one that fits today’s numbers.
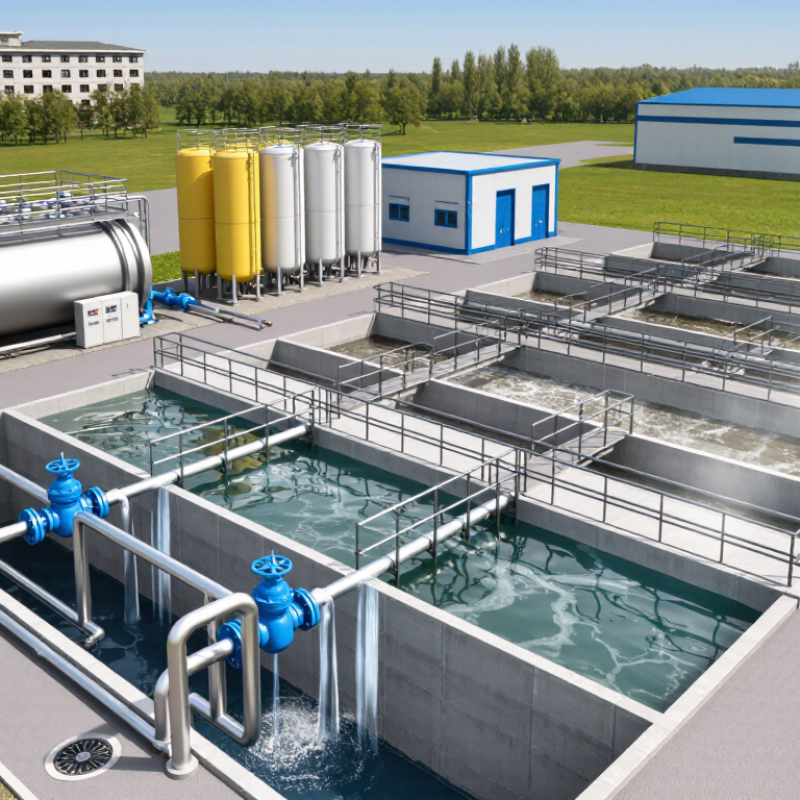
How to Choose a Waste Water Treatment System?

Define Flow and Pollutant Loads Using BOD₅, TSS, TN, and TP

Choosing a wastewater treatment system starts with measured flow and pollutant loads, not equipment capacity. Record average daily flow, peak hourly flow, seasonal changes, and infiltration. A morning shower peak may look very different from a quiet Sunday. The calculation is simple: load (kg/day) equals flow (m³/day) multiplied by concentration (mg/L), divided by 1,000.

BOD₅ indicates biodegradable organic matter and helps estimate biological oxygen demand. TSS measures suspended solids that can settle, clog, or escape with treated water. Nitrogen and phosphorus require closer attention. The US EPA Nutrient Control Design Manual reports typical municipal wastewater concentrations of about 30–50 mg/L total nitrogen and 5–10 mg/L total phosphorus (EPA/600/R-10/100, 2010). These figures are useful benchmarks, not guaranteed site values. Industrial discharge can change them sharply.

Collect flow-proportional composite samples when possible, and test BOD₅, TSS, TN, and TP through a competent laboratory. The US EPA’s Primer for Municipal Wastewater Treatment Systems identifies BOD₅ and TSS as core control parameters (EPA, 2004). One sample is not enough. It may miss weekend surges, cleaning chemicals, or rain-driven dilution. Designers sometimes rely too heavily on average flow, which can understate peak loading. Review at least weekday, weekend, wet-weather, and dry-weather results before sizing tanks, aeration, clarification, and nutrient removal stages.

Set Effluent Targets: BOD₅ and TSS Often Reach 20–30 mg/L

How to Choose a Waste Water Treatment System?

Set effluent targets before comparing treatment equipment. For many municipal and industrial applications, BOD₅ and TSS targets often fall between 20 and 30 mg/L. These values describe biodegradable organic matter and suspended solids remaining after treatment. They are useful planning benchmarks, not universal legal limits. The discharge permit, receiving water, and local authority requirements must guide final design.

Start with reliable data. Measure average flow, peak flow, temperature, pH, BOD₅, TSS, fats, oils, and chemicals. A single sample can mislead. Weekend production may create a different load from weekday production. Rain can also dilute wastewater or overload collection systems. Request laboratory testing across several operating conditions. Small details matter.

Choose a process that can handle variation, not only average results. Biological treatment may reduce BOD₅ effectively, while clarification, filtration, or membrane stages can improve TSS removal. Equalization tanks help control sudden hydraulic and organic shocks. Sludge management deserves equal attention. Poor sludge withdrawal can quickly raise outlet TSS. Operators should also check energy use, maintenance access, spare parts, and monitoring requirements. A polished design can still underperform when staff lack training or instruments. That weakness is easy to overlook.

Compare MBBR, SBR, MBR, and Disinfection by Removal and Footprint

Choosing a wastewater treatment system starts with the required removal level and available land. MBBR uses attached biofilm on moving carriers, giving stable organic removal in a compact tank. The Water Environment Federation reports typical carrier filling rates of 40–70%, but actual performance depends on aeration, temperature, and loading. SBR combines biological treatment and settling in one basin. It can remove carbon and nutrients effectively, yet its batch cycles require equalization or multiple tanks for continuous flows.

MBR usually provides the clearest effluent. Membrane separation can produce very low suspended solids and turbidity, while the U.S. EPA reports that MBR facilities may use roughly one-third to one-half the footprint of conventional activated-sludge plants. The trade-off is higher energy demand and membrane fouling risk. A 2022 International Water Association report also identifies energy and maintenance as major MBR cost drivers. Disinfection is different. Ultraviolet light or chemical treatment reduces pathogens after biological removal, but it does not replace carbon or nitrogen treatment. The U.S. EPA Guidelines for Water Reuse emphasize multiple barriers and validated pathogen targets.

No option wins every time. A compact MBR may suit a constrained urban site. SBR can be practical where land and flow variation are manageable. MBBR offers flexibility during expansion, though its footprint advantage is sometimes overstated. Pilot testing matters. Real wastewater rarely behaves like design data.

How to Choose a Wastewater Treatment System?

Comparison of representative municipal-treatment performance and planning-level footprint. Removal values are typical midpoint estimates; actual results depend on influent quality, temperature, loading, and design.

Interpretation: MBR generally provides the highest BOD and TSS removal with a compact footprint. SBR offers strong removal with flexible batch operation, while MBBR provides reliable biological treatment with a moderate footprint. Disinfection is a final-barrier process for pathogens and does not replace biological treatment; its footprint is usually small but depends on contact time, equipment, and safety requirements.

Estimate Energy Demand at Approximately 0.3–0.8 kWh/m³

How to Choose a Waste Water Treatment System?

Estimate Energy Demand at Approximately 0.3–0.8 kWh/m³

Energy demand should be an early selection criterion, not an afterthought. A practical planning range is 0.3–0.8 kWh per cubic metre treated. For a 1,000 m³/day facility, that equals roughly 300–800 kWh daily. The spread is significant.

Aeration often consumes the largest share of electricity. Influent strength, oxygen targets, pumping height, sludge handling, and discharge limits can shift the result. The Water Environment Federation identifies aeration and pumping as major energy loads in wastewater facilities. The International Energy Agency also reports that the water sector uses about 4% of global electricity.

Ask for measured data from comparable plants. A supplier’s theoretical figure is not enough. Request energy values under average flow, peak flow, cold weather, and low-load conditions. Check whether the number includes sludge dewatering and internal pumping. Many estimates quietly exclude them.

The 0.3–0.8 kWh/m³ range is useful, but imperfect. I would treat it as a screening tool. Site measurements should replace assumptions before final investment approval. A 0.1 kWh/m³ difference may appear small, yet it becomes 36,500 kWh annually at 1,000 m³/day. That cost deserves attention. Performance can also drift after commissioning, especially when operators lack stable monitoring routines.

Check Compliance, Reuse Standards, Monitoring, and Lifecycle Costs

How to Choose a Waste Water Treatment System?

Compliance should guide the design, not appear during final inspection. Start by identifying discharge limits, receiving-water conditions, and the intended reuse application. ISO 16075-1:2020 provides guidance for treated wastewater used in irrigation. The WHO guidelines also emphasize health-based targets and risk management. Local permits may demand stricter controls. Check them early. A treatment train that meets today’s limits may fail after production expands.

Reuse standards determine the necessary barriers. Irrigation may require reliable removal of pathogens, suspended solids, salts, or nutrients. Process reuse can require tighter conductivity and chemical control. UNESCO’s 2024 World Water Development Report states that agriculture represents about 70% of global freshwater withdrawals. That figure supports reuse, but it does not justify careless reuse. Crop sensitivity, soil drainage, and worker exposure still matter. I would not specify ultraviolet treatment only because it sounds advanced.

Monitoring must prove performance continuously. Measure flow, pH, turbidity, conductivity, dissolved oxygen, and key contaminants. Online instruments need calibration records and laboratory verification. Sampling points should represent actual operating conditions, including startup and cleaning cycles. Alarm limits should trigger action, not merely create dashboard colors. This is where many systems look complete but remain operationally weak.

Compare lifecycle costs, not equipment prices. Include energy, chemicals, membranes, sludge handling, laboratory testing, labor, and replacement parts. The U.S. Environmental Protection Agency’s water reuse guidance supports evaluating treatment reliability alongside economics. A cheaper system can become expensive through frequent fouling or disposal fees. Build a five- to fifteen-year model. Then challenge its assumptions. Forecasts are useful, but wastewater rarely behaves perfectly.

FAQS

What effluent targets should I consider for BOD₅ and TSS?

Many municipal and industrial systems use 20–30 mg/L as planning benchmarks. These are not universal legal limits. Confirm final limits with permits and local authorities.

What wastewater data should I collect before choosing equipment?

Measure average and peak flow, temperature, pH, BOD₅, TSS, fats, oils, and chemicals. Test several operating conditions. One sample can mislead.

Why are peak flows and production changes important?

Weekend production may create different organic loads than weekday operations. Rain can dilute wastewater or overload collection systems. Design for variation, not averages alone.

Which treatment stages can reduce BOD₅ and TSS?

Biological treatment often reduces BOD₅ effectively. Clarification, filtration, or membrane stages can improve TSS removal. The best combination depends on wastewater quality.

How can a system handle sudden wastewater changes?

An equalization tank can reduce hydraulic and organic shocks. It acts like a buffer during sudden flow changes. It is not a complete solution.

What should I check when planning treated water reuse?

Identify the reuse purpose, crop sensitivity, soil drainage, and worker exposure. Irrigation may need pathogen, salt, nutrient, and solids control. Reuse requires caution.

How should treatment performance be monitored?

Track flow, pH, turbidity, conductivity, dissolved oxygen, and key contaminants. Calibrate online instruments and verify results through laboratory testing. Dashboard colors prove little.

What costs should a treatment system comparison include?

Include energy, chemicals, membranes, sludge handling, testing, labor, and replacement parts. Build a five- to fifteen-year cost model. Forecasts can still be wrong.

Why can a technically advanced treatment system underperform?

Poor sludge withdrawal can quickly increase outlet TSS. Limited training, weak maintenance access, or missing instruments can also reduce performance. I might overlook these risks.

Conclusion

Choosing a Waste Water treatment system begins with understanding the quality and quantity of the incoming stream. Measure daily and peak flow, then assess pollutant loads using BOD₅, TSS, TN, and TP. These values help determine process capacity and treatment requirements. Next, define the desired effluent quality; for many applications, BOD₅ and TSS targets of approximately 20–30 mg/L may be appropriate, although local requirements and reuse objectives should guide the final limits.

Compare available processes such as MBBR, SBR, MBR, and disinfection according to removal performance, site footprint, operational complexity, and resilience to flow changes. Energy demand should also be included in early planning, with a preliminary estimate of about 0.3–0.8 kWh/m³ depending on the selected process and operating conditions. Before making a decision, confirm compliance obligations, reuse standards, monitoring needs, maintenance requirements, and total lifecycle costs. A balanced evaluation will produce a reliable, efficient, and suitably sized system.


Oliver

Oliver

Oliver is a seasoned marketing professional with a wealth of expertise in driving brand awareness and engagement. With a deep understanding of our company's product offerings, he consistently delivers high-quality content that enriches our professional blog. His insights not only shed light on......